Open the four .mat files, walk through the eleven channels, and explain what each one carries — including a small puzzle the data documentation doesn’t resolve.
1.1 What’s inside a .mat file
Two top-level fields in every session: fs (the sampling rate) and y (the data, channels × time). Eleven channels at 256 Hz, recording about three and a half minutes per session — matching the four-minute runs reported in Guger et al. (2012).
What each row carries:
CH1 is a linear ramp — the sample-time index, not a recorded signal.
CH2–CH9 are the eight occipital EEG channels (PO7, PO3, POz, PO4, PO8, O1, Oz, O2).
CH10 sits at zero between trials and steps to one of {9, 10, 12, 15} during stimulation, encoding the active LED frequency in Hz.
CH11 is g.tec’s LDA prediction — our baseline competitor for everything that follows.
One thing that isn’t in data_description.txt: CH11’s non-zero values are small integers — class indices, not frequencies. The class-to-frequency mapping comes from data/subject_1_fvep_led_training_1_result2d.PNG, which shows the g.tec analysis tool with the four classes laid out as 1 → 15 Hz, 2 → 12, 3 → 10, 4 → 9 (highest class index → lowest frequency). Always audit every file the organizers shipped, not just the obvious-looking text one.
1.2 The four recordings
The dataset only ships four files, so we’ll plot all of them. EEG panels are clipped to ±50 µV (clinical-EEG display convention); the amplifier-startup transient at t = 0 is left visible as a truncated spike.
CH11 also fires intermittently — it only outputs a class when the LDA’s confidence (presumably) crosses a threshold, so per-sample agreement against CH10 isn’t the right way to evaluate the baseline. That needs trial-level evaluation, deferred to Ch 7.
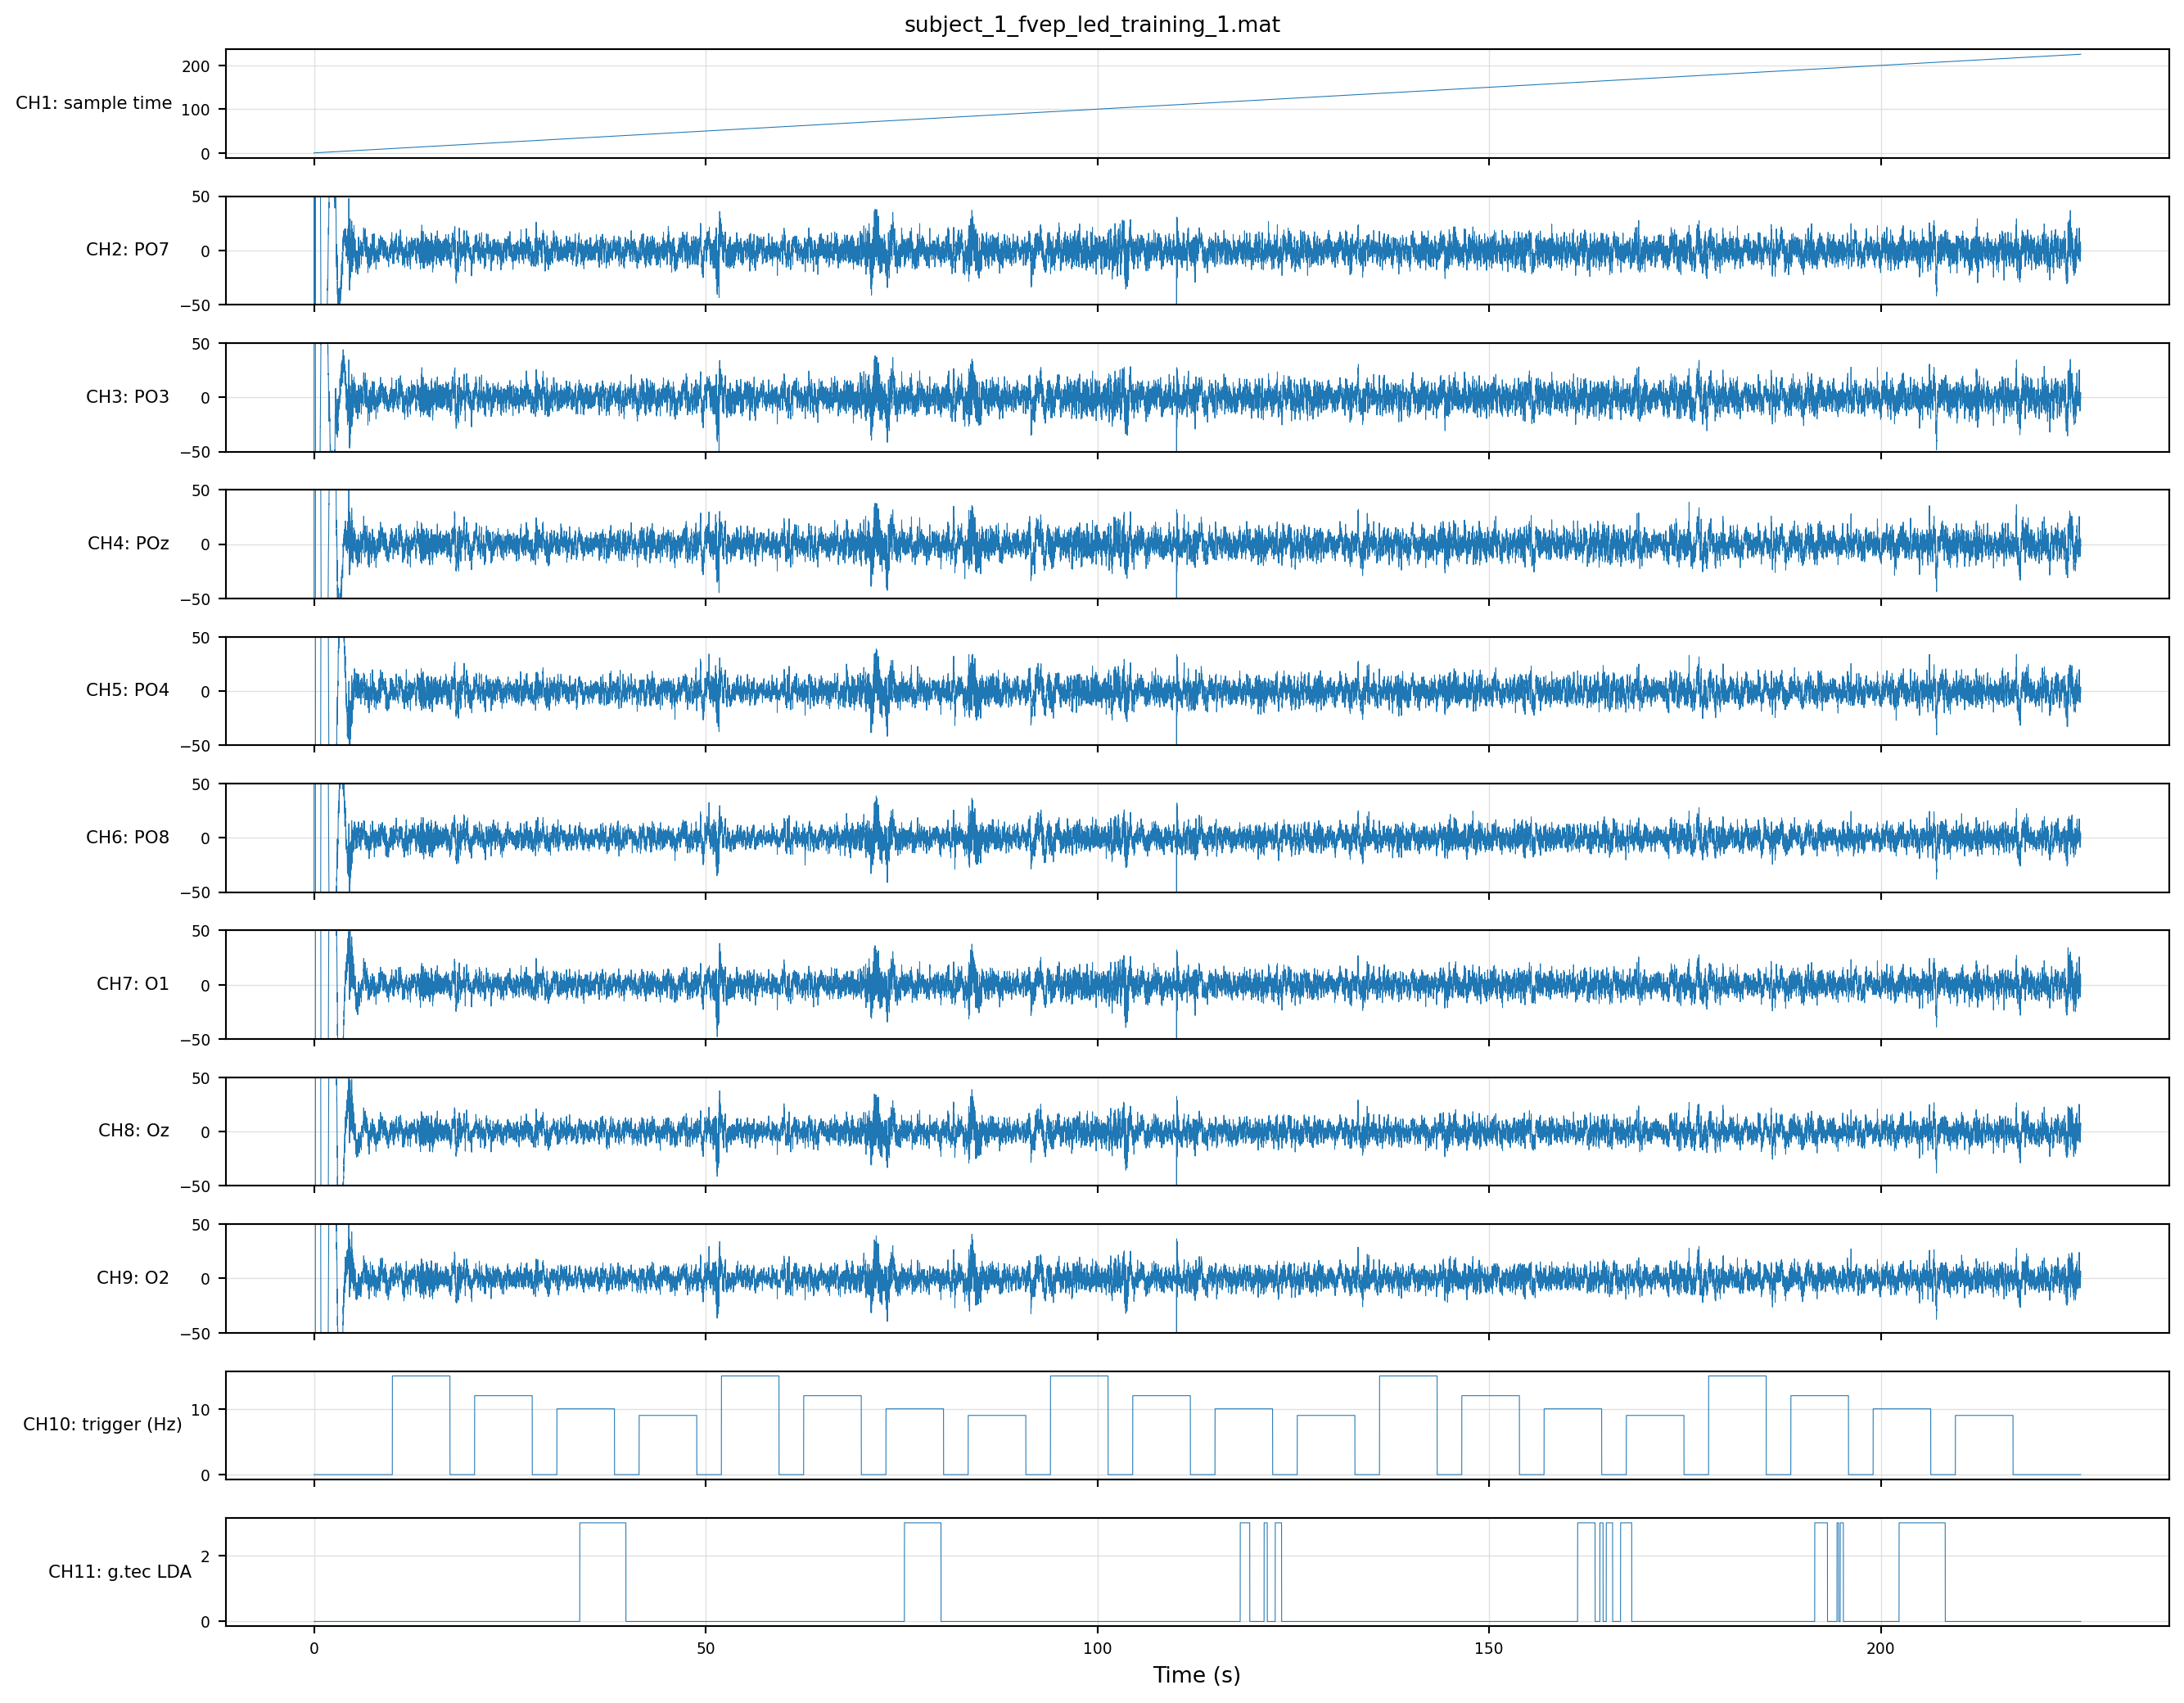
Twenty stimulation blocks on CH10, evenly split across the four frequencies. CH11 is the standout: it only ever outputs class 3, regardless of which LED is flashing. The LDA in this session is broken in some way — we’ll come back to it in Ch 7 when we evaluate the baseline trial by trial.
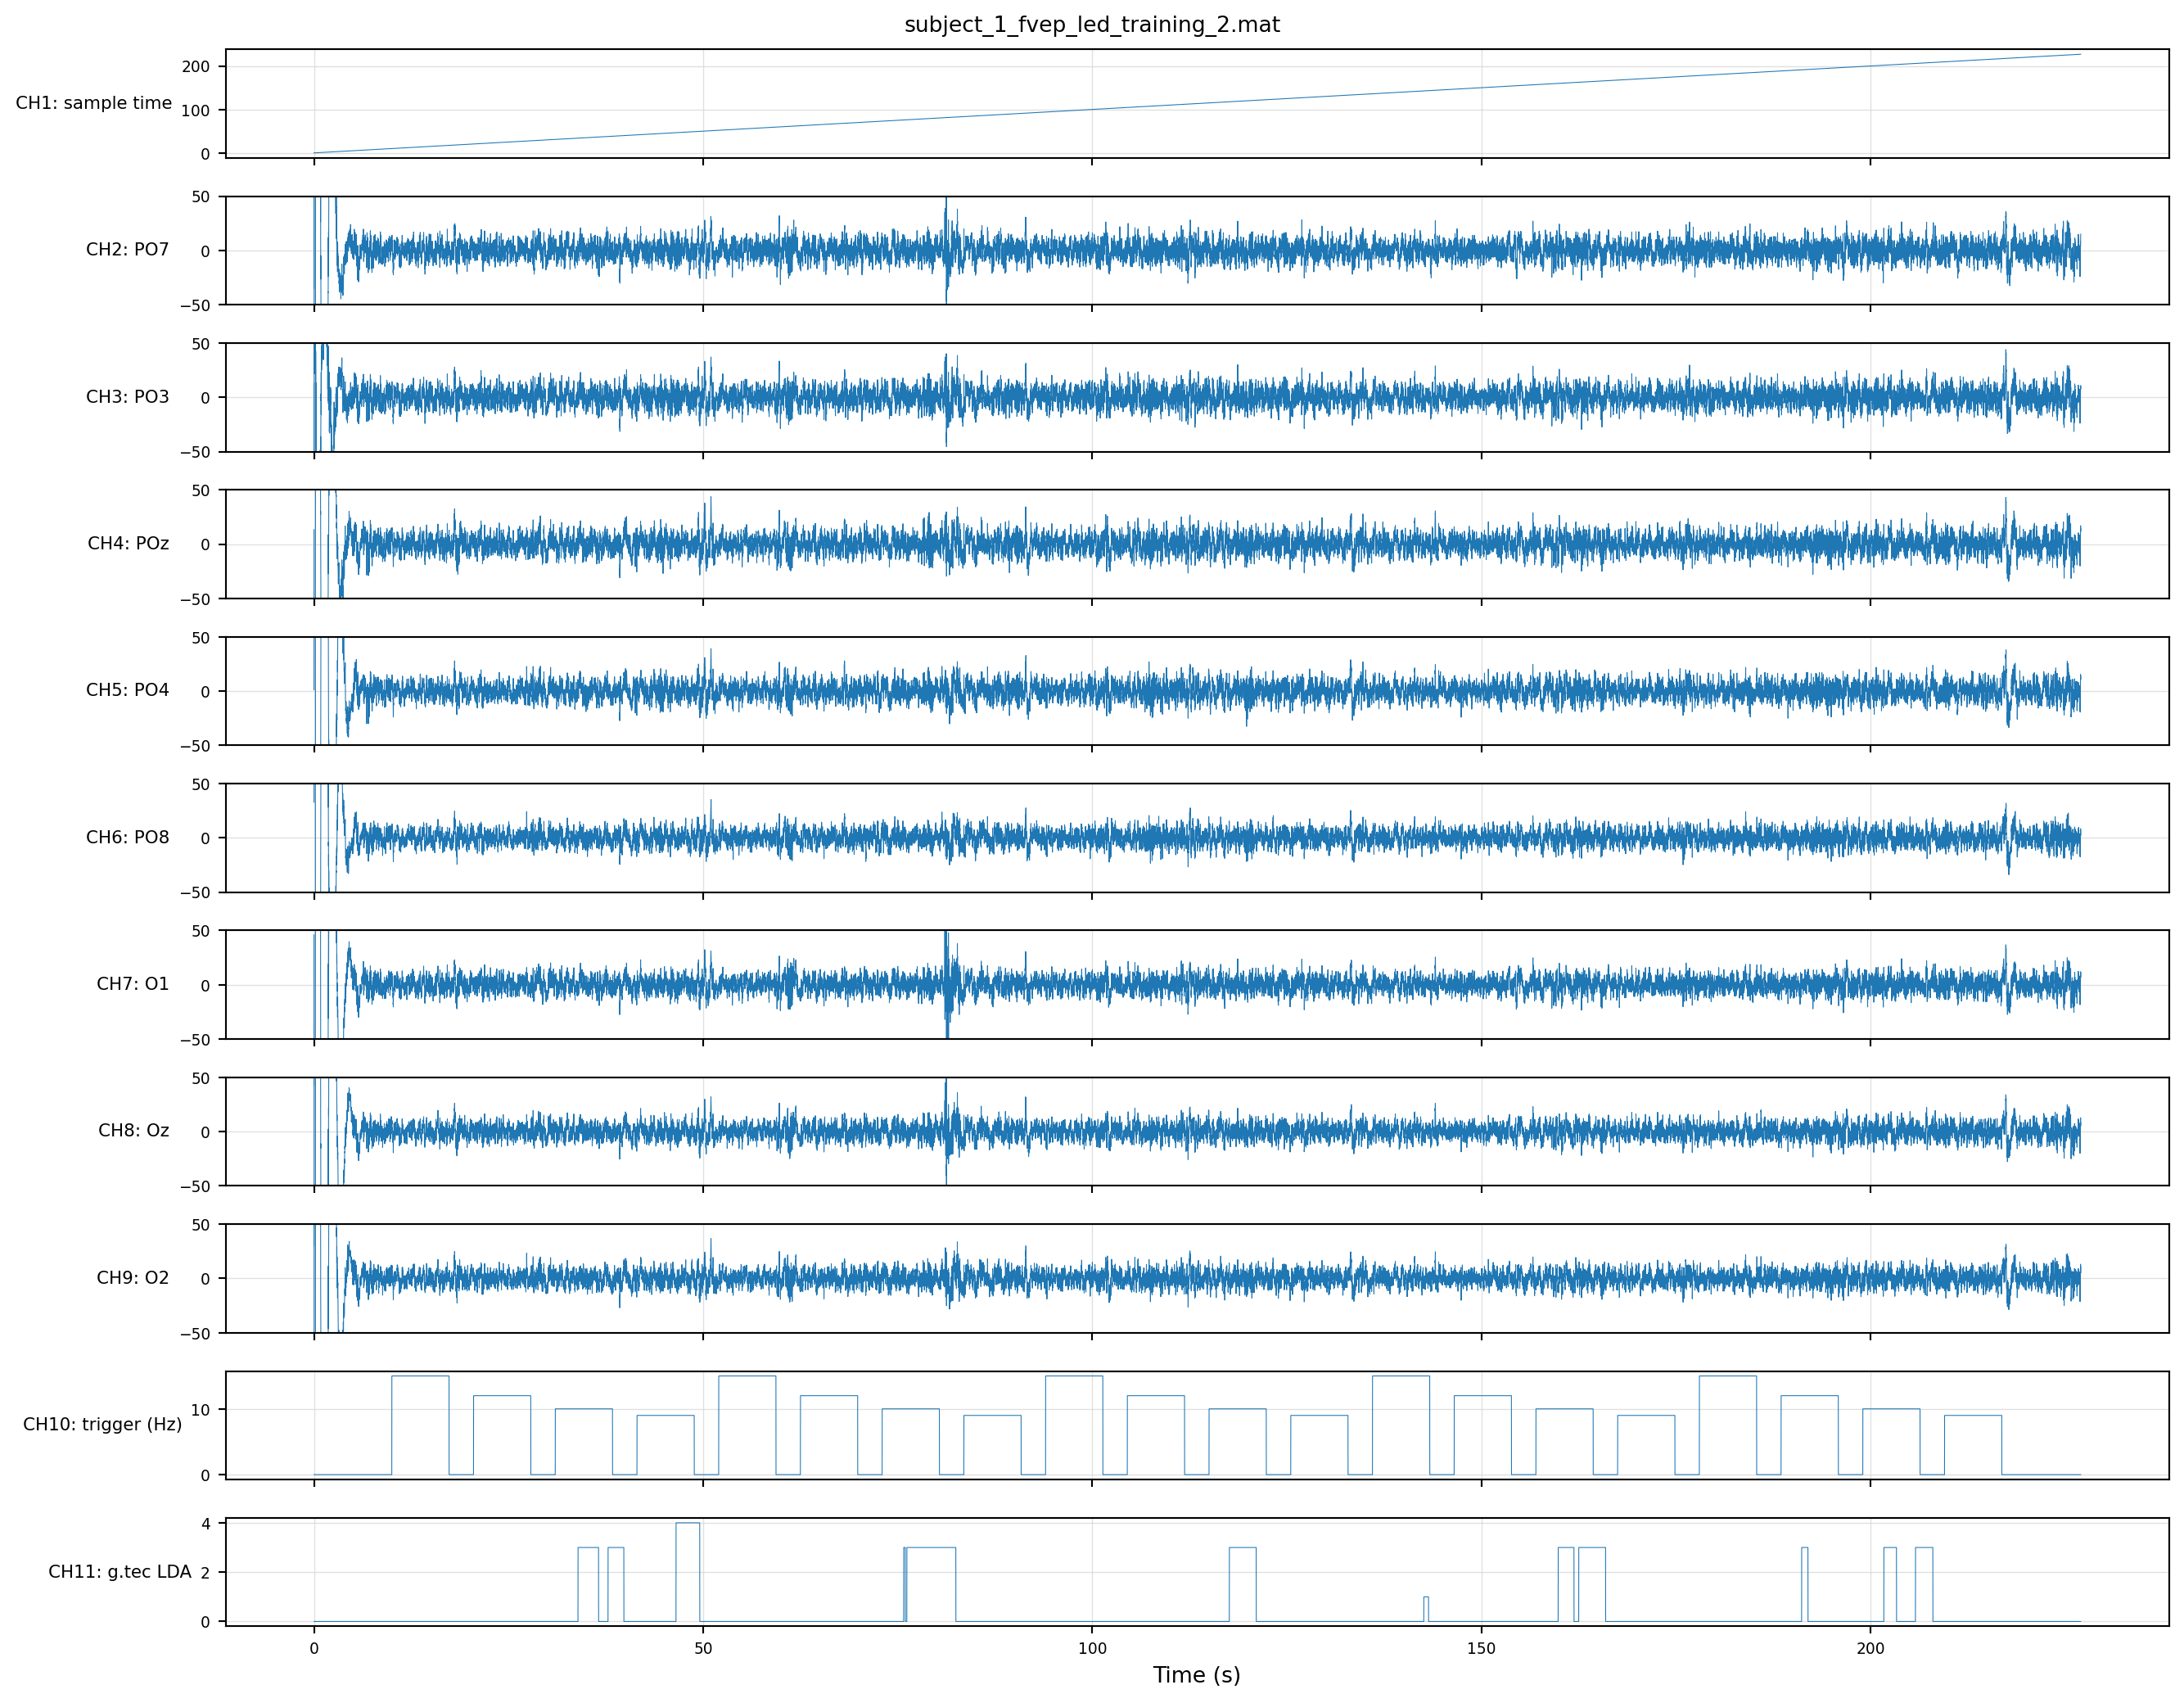
Same trial structure — twenty balanced blocks. CH11 now fires three of the four classes; class 2 (12 Hz, per the mapping above) never appears, even though the trigger does step to 12 Hz five times. The LDA isn’t broken in the same way as run 1, but it’s still missing a class.
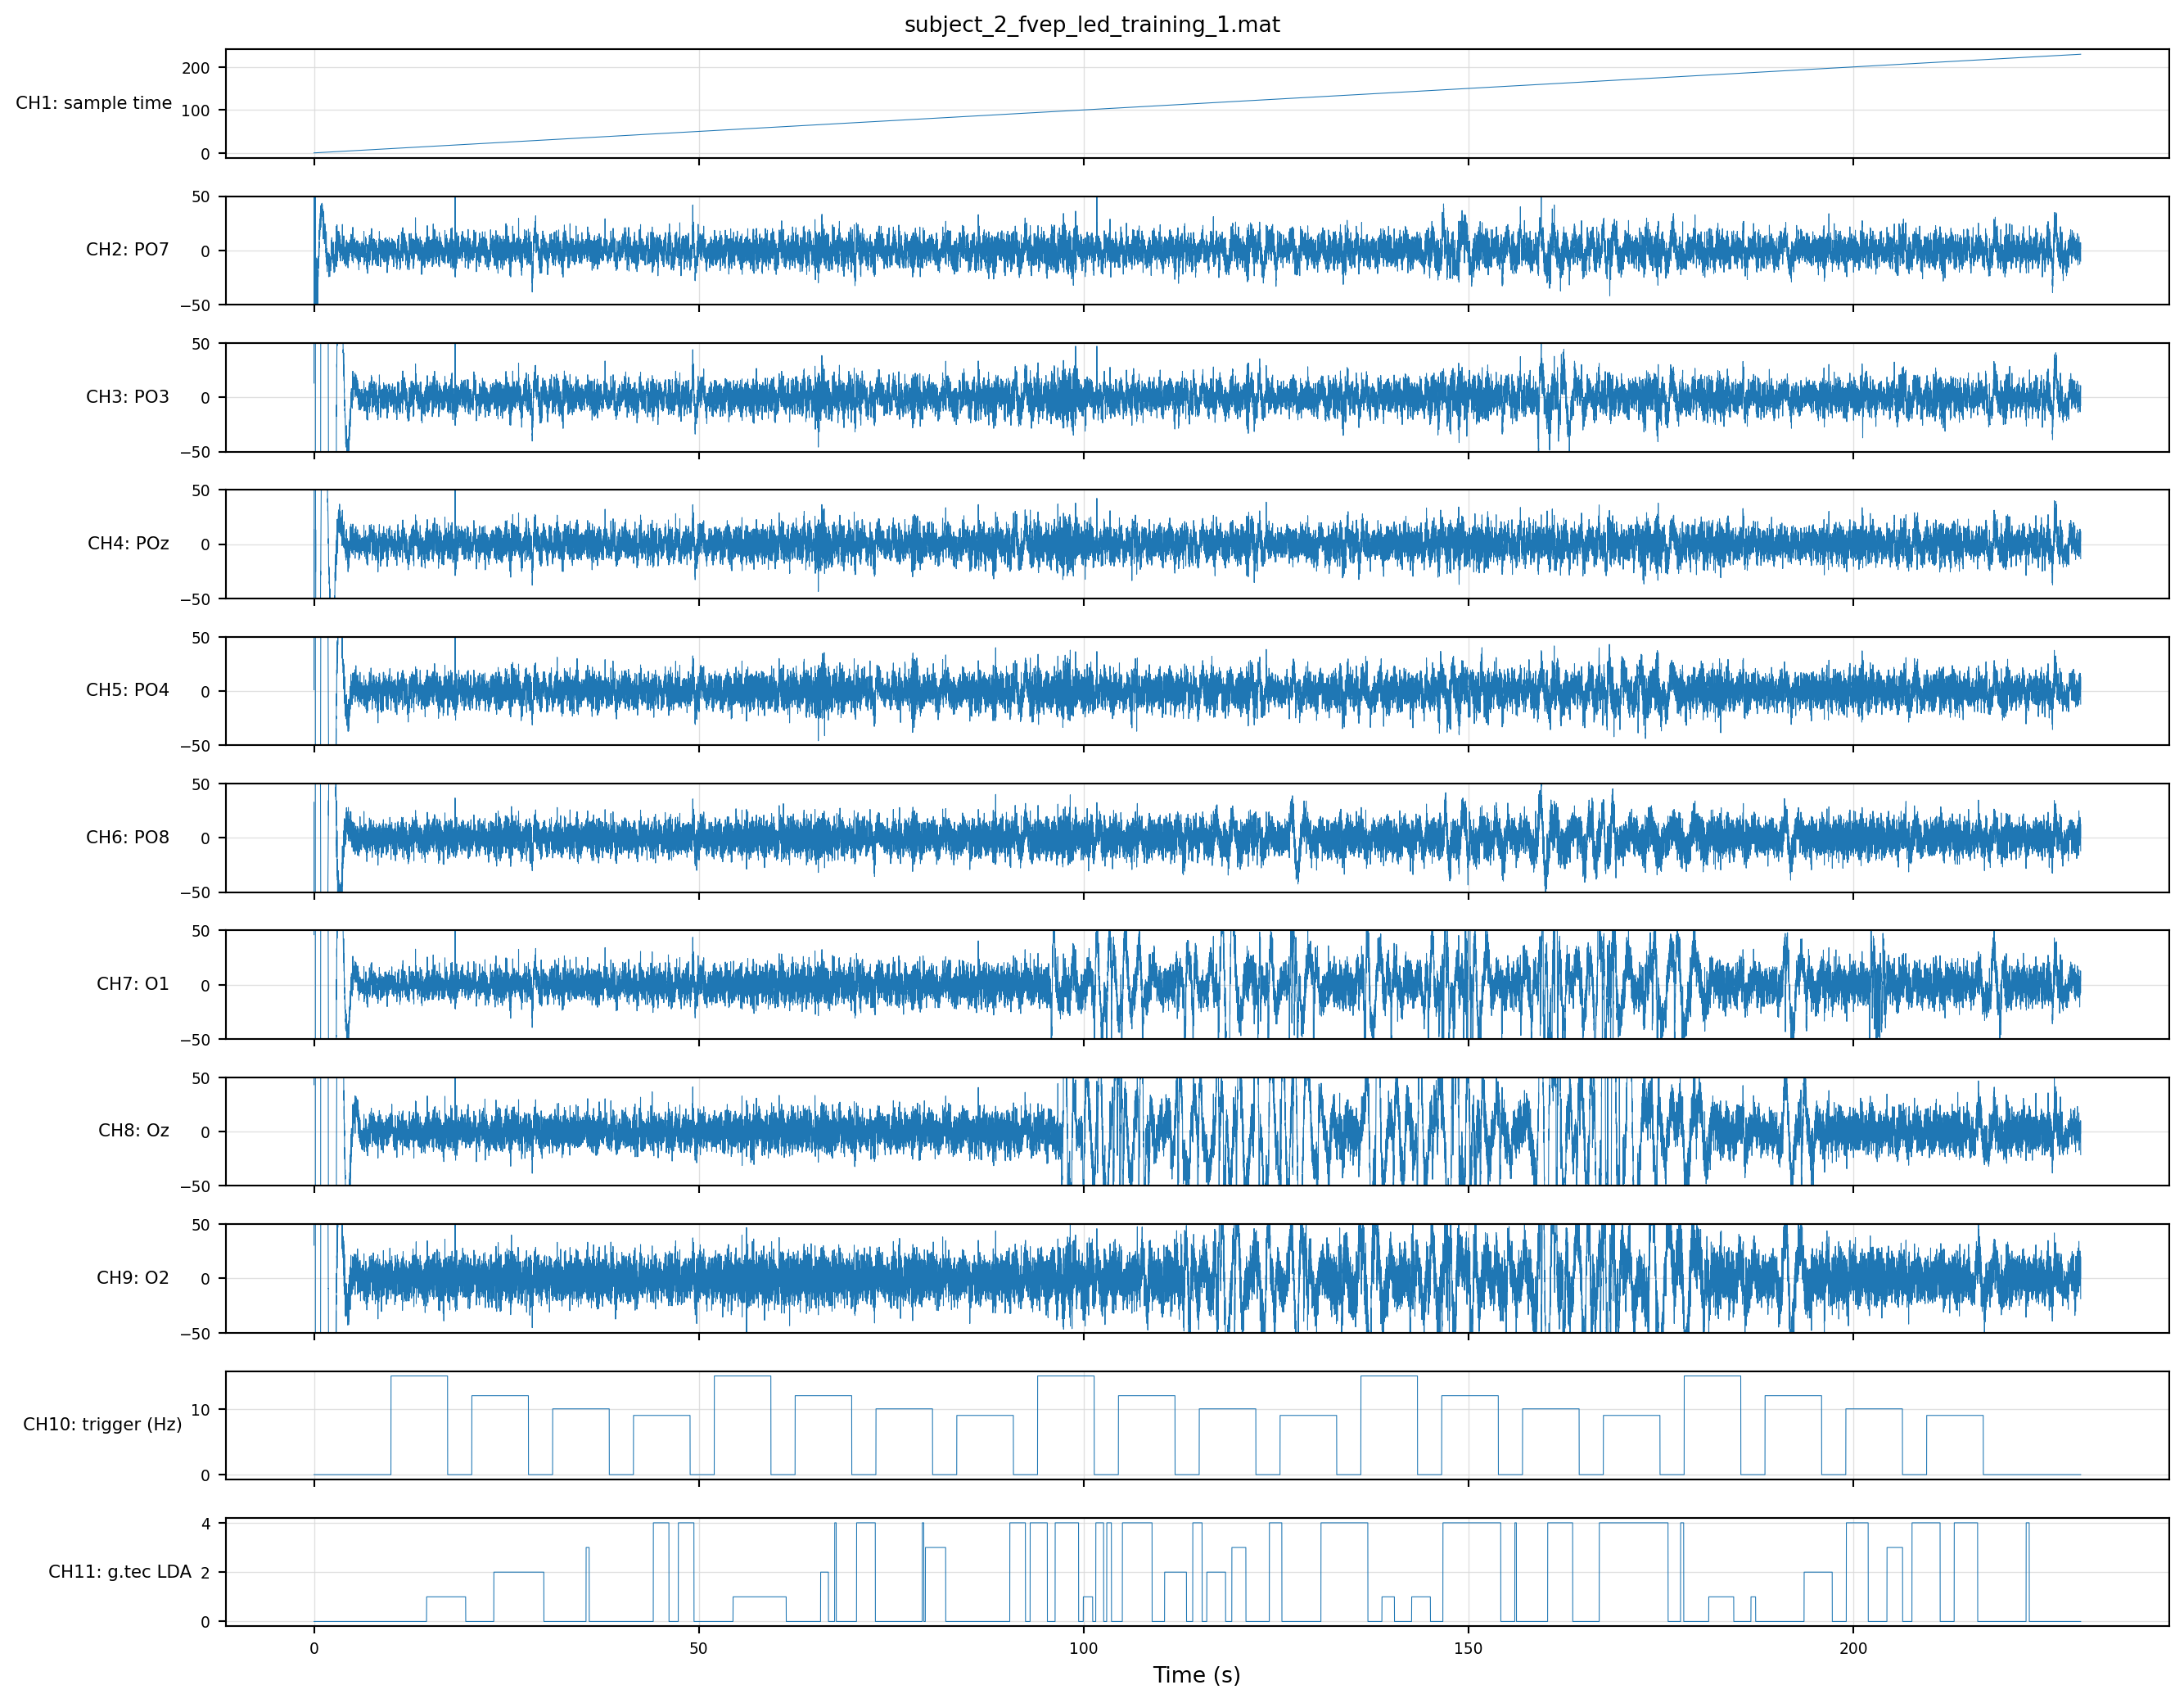
CH11 covers all four classes here, and fires for a much larger fraction of samples than either subject-1 session — the LDA is genuinely trying in this run. The flip side: data quality is poor. PO3 and O1 hit the ±50 µV clip throughout, and the occipital channels (Oz, O2) degrade further past the ~120 s mark — by the second half of the session their panels are essentially solid blocks of saturation. Only POz, PO4, and PO8 stay reasonably contained. Sustained clipping on that many channels usually points at electrode contact issues (high impedance, sweat bridges) rather than brain signal, which is why this run isn’t the running example for later chapters.
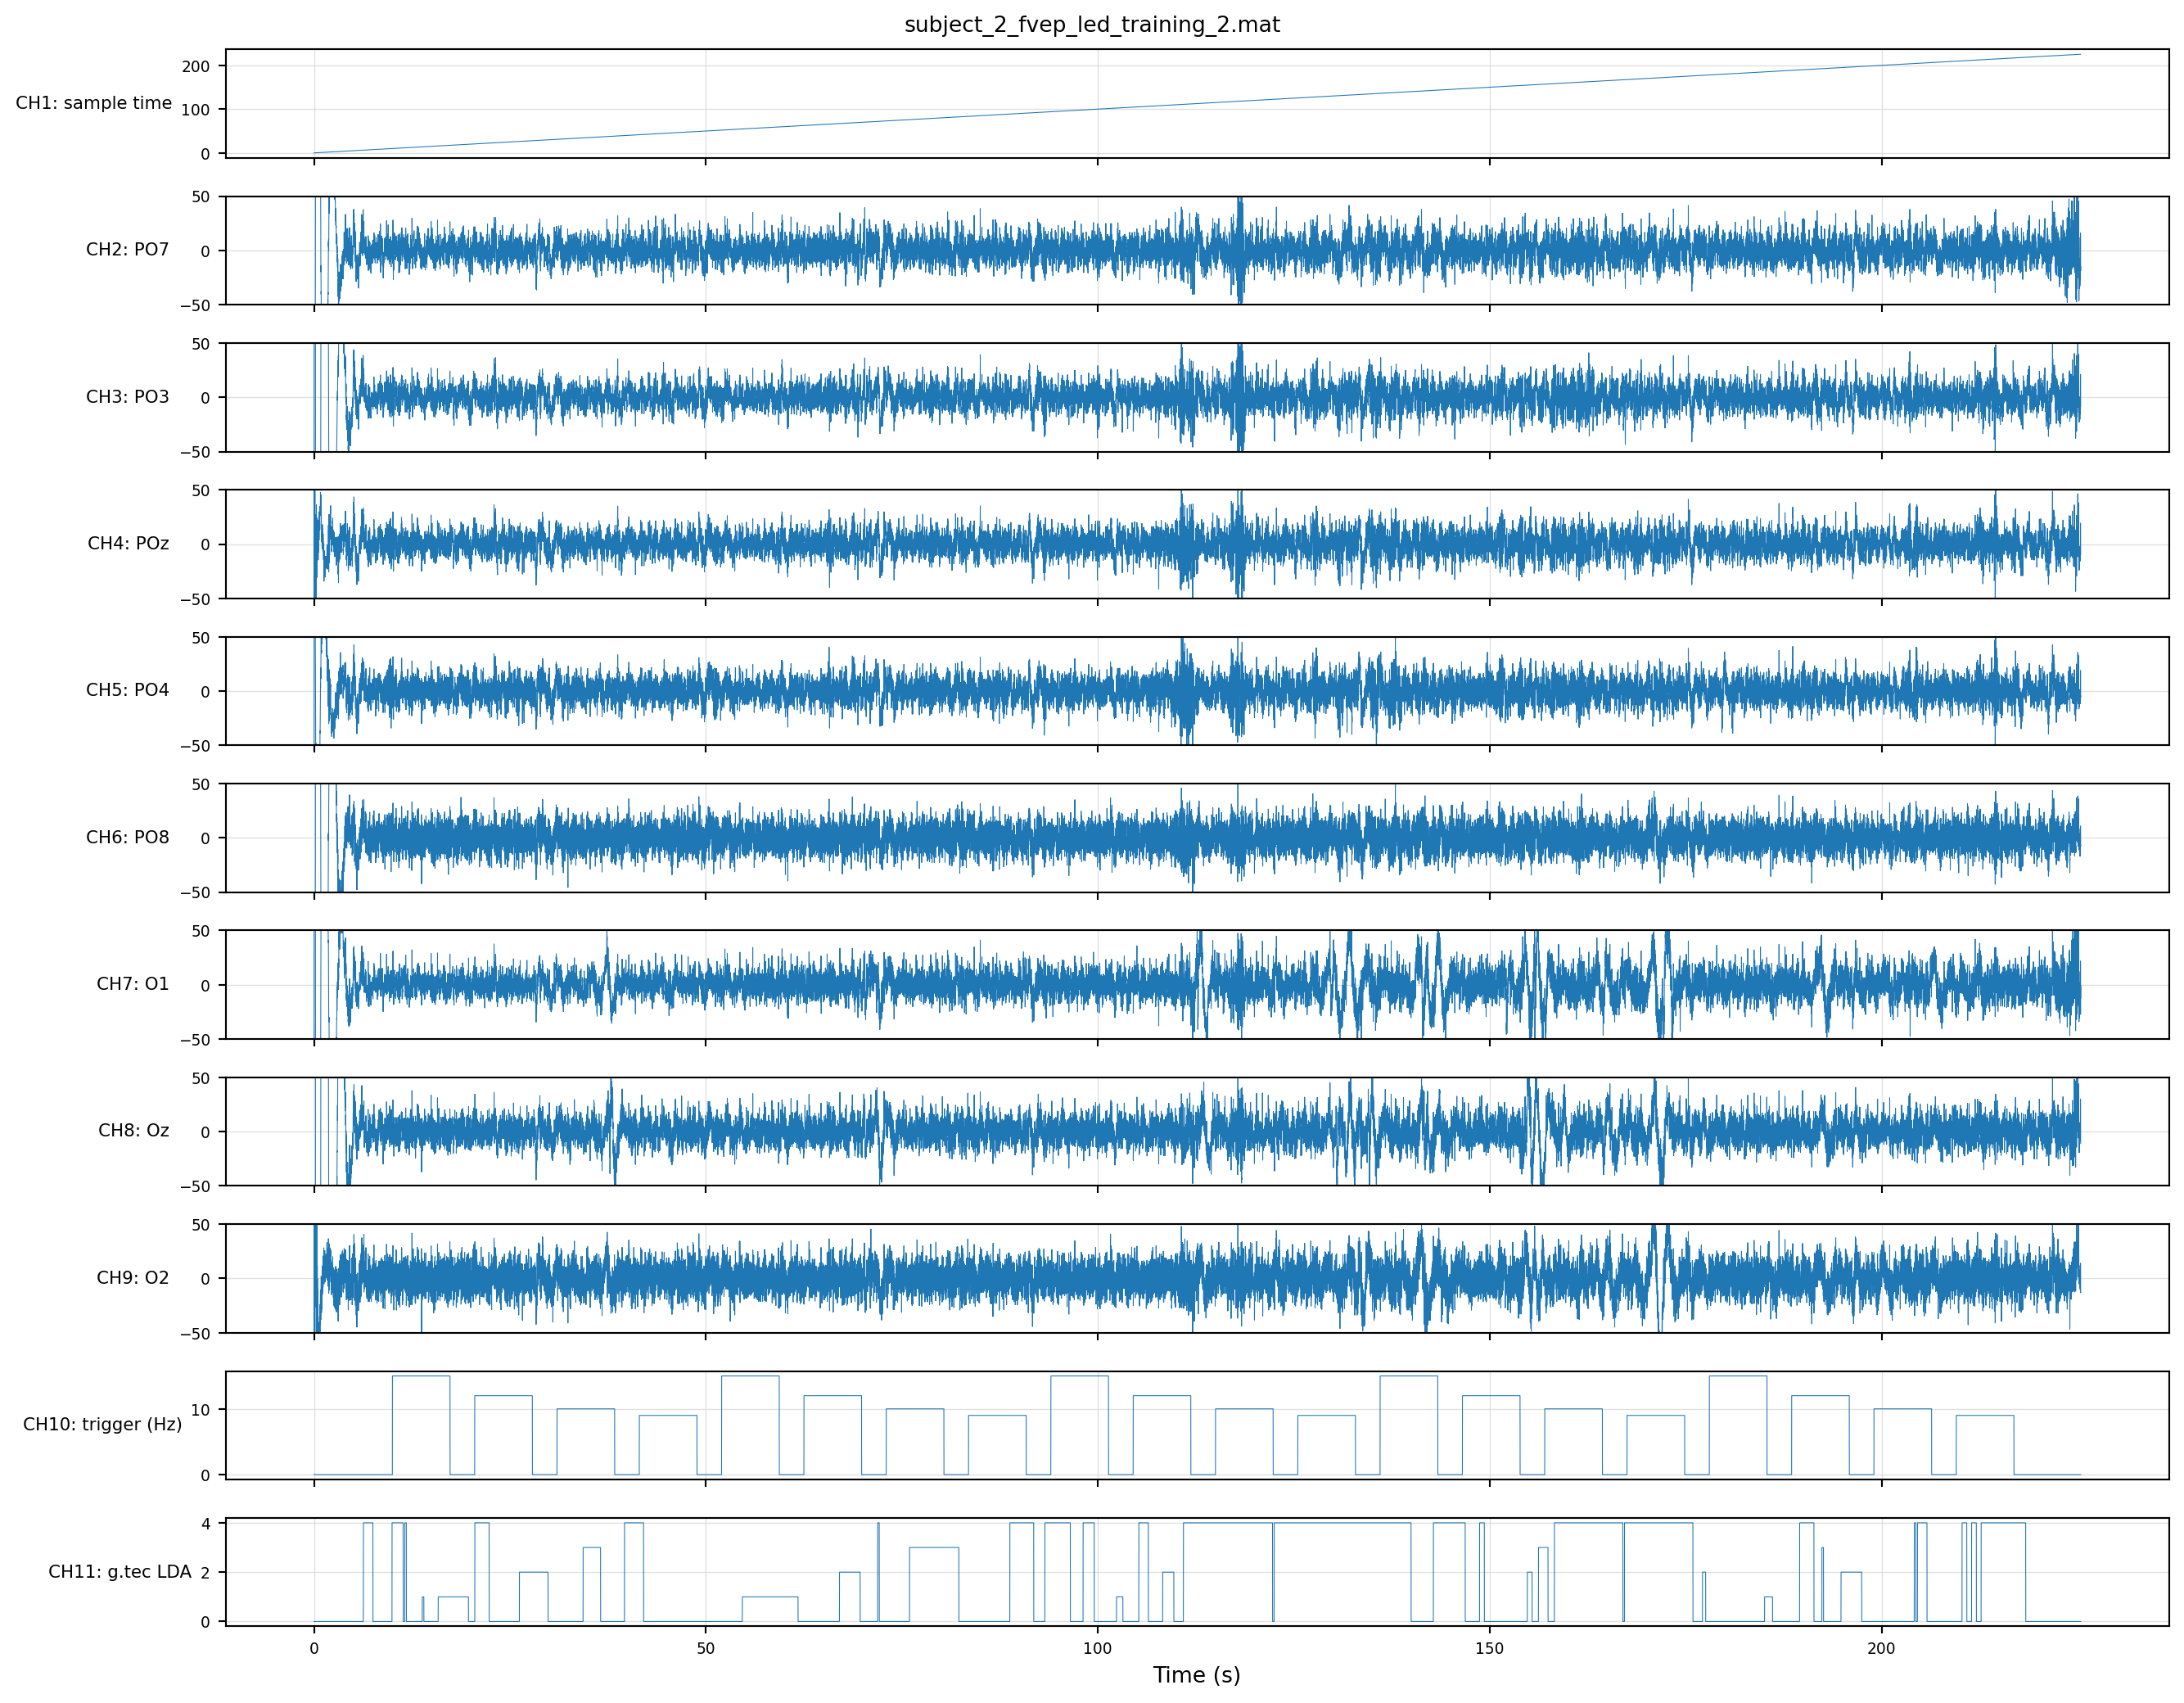
Twenty trials, all four classes on CH11, EEG channels mostly quiet within the clip. The cleanest of the four for downstream work — and the one we’ll lean on as the running example in later chapters.
Guger, Christoph, Brendan Z. Allison, Bernhard Großwindhager, et al. 2012. “How Many People Could Use an SSVEPBCI?”Frontiers in Neuroscience 6: 169. https://doi.org/10.3389/fnins.2012.00169.