br41n.io - SSVEP Data Analysis
About
Developed as a submission to SSVEP Data Analysis hackathon at br41n.io Spring School 2026, organised by g.tec
In a hurry? Watch the two-minute slide walkthrough — the entire pipeline in seven slides.
A code-first walkthrough of the br41n.io SSVEP dataset, structured around the canonical EEG analysis pipeline: data → preprocessing → feature engineering → modelling → evaluation. Every chapter follows the same shape — runnable code, a generated artifact, then the theory that explains what the artifact shows.
The core idea, in one picture
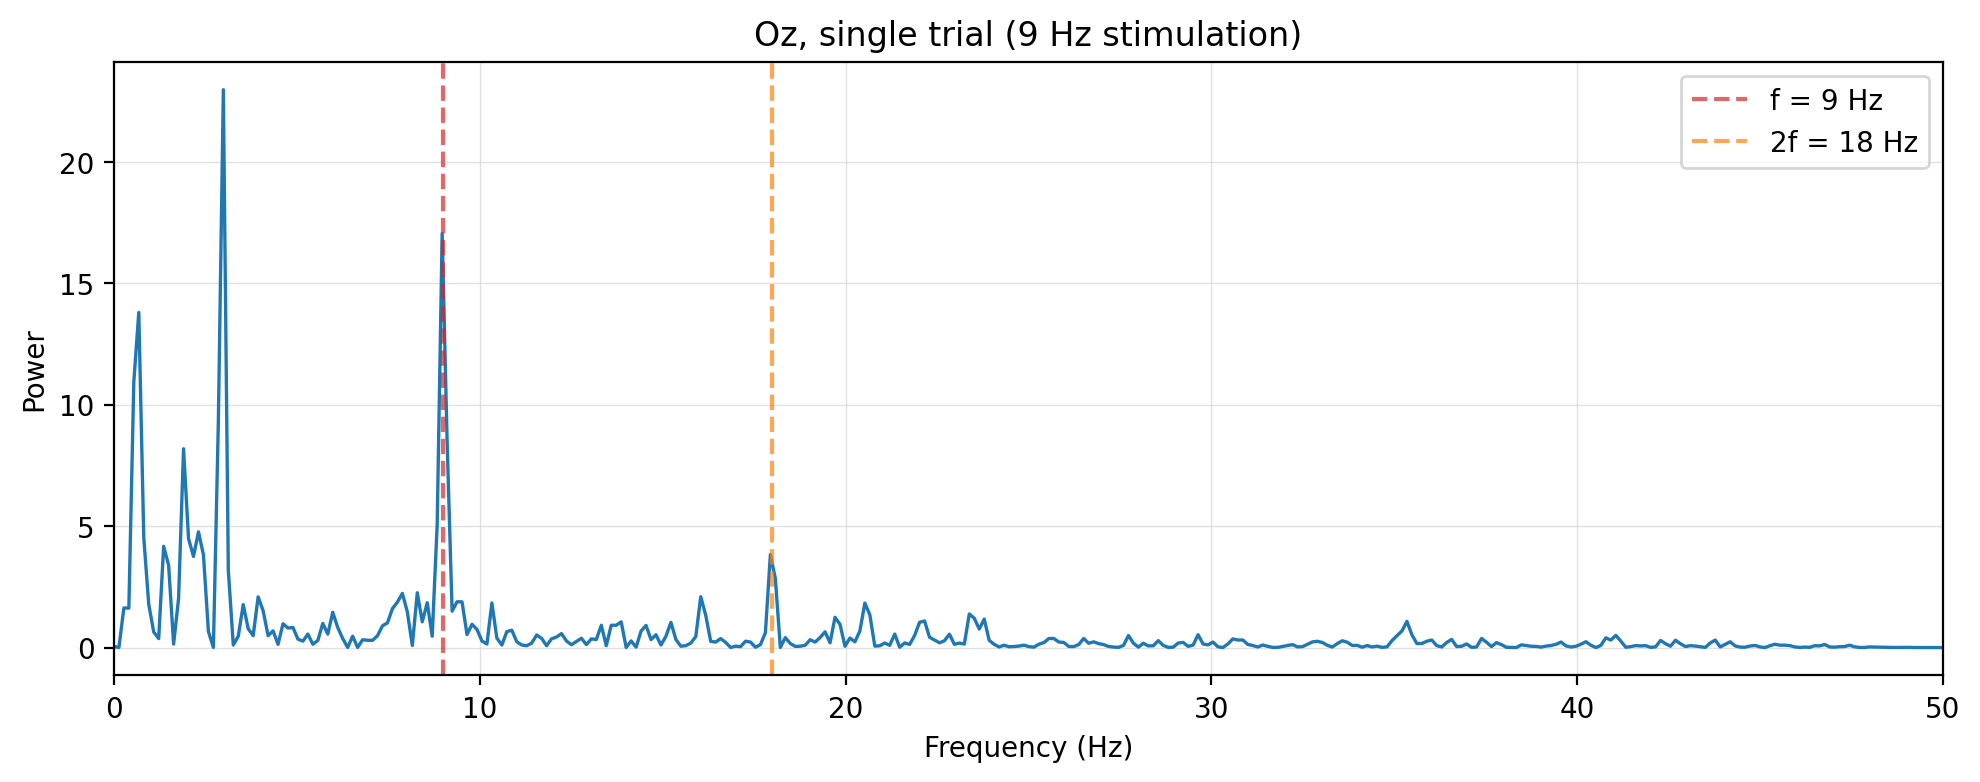
That spike is the entire trick behind this analysis. Flicker four lights at four different frequencies, look at one of them, and the EEG “echoes” the frequency you’re staring at. Read that echo, and you know which light the person picked — a brain–computer interface (BCI) with no surgery, no training, and not much hardware. This is SSVEP: Steady-State Visual Evoked Potentials.
Getting from raw EEG to that clean spike is what the first six chapters walk through. Chapter 1 opens the .mat files and shows what raw EEG even looks like; Chapter 2 finds the spike above; Chapter 3 filters out everything that isn’t it; Chapter 4 chops the recording into per-trial epochs using the trigger channel; Chapters 5 and 6 turn each epoch into features — spectral peaks and CCA/FBCCA templates — that a classifier can act on.
And it actually works
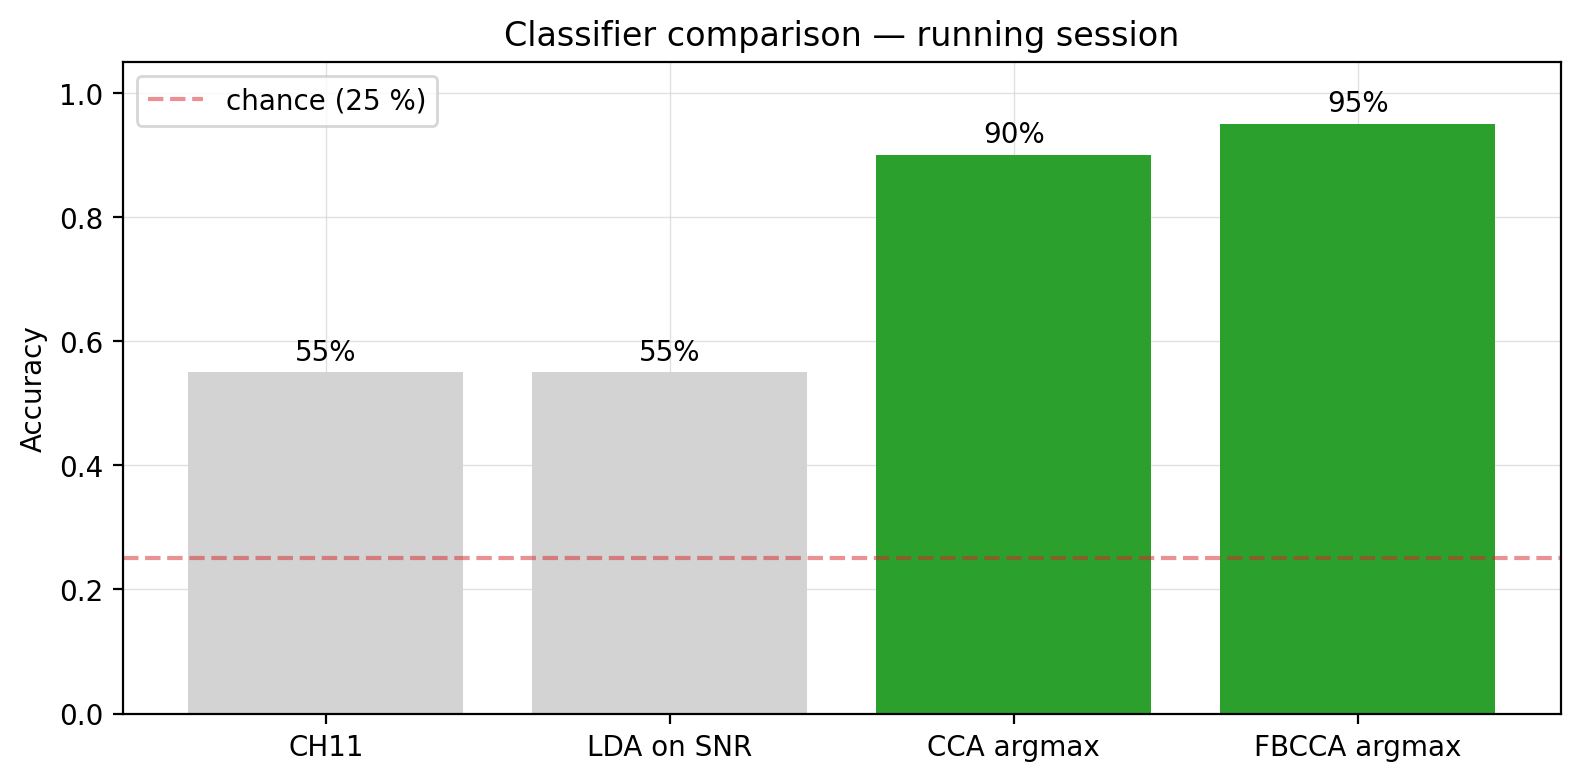
Going from the squiggly raw EEG to a 95%-accurate four-way classifier is what the chapters walk through — one runnable artifact at a time. By the end of Chapter 7 you’ve built that bar chart yourself; Chapter 8 asks how fast the BCI can communicate; Chapter 9 asks how well it generalises across people.
What’s in the dataset
- 2 subjects, 2 training sessions each — four
.matrecordings indata/. - 8 EEG channels clustered over visual cortex (PO7, PO3, POz, PO4, PO8, O1, Oz, O2), sampled at 256 Hz.
- 4 stimulation frequencies: 9, 10, 12, 15 Hz, delivered by an LED array (fVEP-LED).
- A trigger channel marking which frequency is active.
- A pre-computed LDA prediction from g.tec’s pipeline that we use as a baseline.
How the book is structured
| Part | Chapters |
|---|---|
| Data | What’s in the recordings, where the SSVEP shows up |
| Preprocessing | Filtering, epoching from triggers |
| Feature Engineering | Spectral features, CCA / FBCCA template features |
| Modelling | Turning features into a class label |
| Evaluation | Time vs. accuracy, ITR, inter-subject variability |
How to read it
Each chapter is one or more code → artifact → theory blocks. The code is meant to be run; the artifacts are regenerated from the code (and live in images/ prefixed by the chapter filename); the theory after each artifact explains what just happened and why it matters.